Prime Offer: Save 20% Off on your preferred services! Apply Coupon: INVEST20 | Avail Offer
Prime Offer: Save 20% Off. Avail Offer
Prime Offer: Save 20% Off on your preferred services! Apply Coupon: INVEST20 | Avail Offer
Prime Offer: Save 20% Off on your preferred services! Apply Coupon: INVEST20 | Avail Offer
Prime Offer: Save 20% Off. Avail Offer
May 10, 2017
|
At the start of every month, we collect and publish the top news that affected Indian equity Aprilkets the month before, to help our readers be in touch with the overall Aprilket conditions and thereby make sAprilter and informed investment decisions. Continuing our trend of our exclusive monthly newsletter, we again bring to you, all movers and shakers for the first month of FY2018. Hope you find the newsletter insightful and have a good time reading it. Sit back, and enjoy:
Vehicle sales for the first month of FY2017 started with a bang, well, at least for most of the passenger vehicle manufacturers. India’s largest car maker, Apriluti Suzuki recorded stellar numbers and thereby regained its No. 1 position by crossing the 50% Aprilket share figure.
After the BS-III vehicle ban at the end of March 2017, there was a huge surge in the people buying their vehicles at a pleasing 30-50% discount, which eventually helped the stakeholders clear a major chunk of their inventories. But this also resulted in a heavy pre-buying and thereby affected the sales numbers of the very next, which is evident from the figures of Tata Motors, Hero Motocorp, Bajaj Auto, etc.
Leaving aside November and December 2016, vehicle sales in India have been growing at a healthy pace. Ford India also reported phenomenal growth in numbers, especially in exports, which grew by more than 76%, from 9,939 vehicles in April 2016 to 17,531 in April 2017. Toyota India, Escorts and Royal Enfield, like every month, showed continuous growths in volumes. Have a look at the numbers:
| Company Name | April 2017 Sales | April 2016 Sales | Growth% |
|---|---|---|---|
| Ford India | 25,149 | 16,470 | 52.70% |
| Toyota India | 14,055 | 9,507 | 47.84% |
| Royal Enfield | 60,142 | 48,197 | 24.78% |
| Escorts | 4,899 | 4,086 | 19.90% |
| Maruti Suzuki | 151,215 | 126,569 | 19.47% |
| TVS Motor | 246,310 | 227,096 | 8.46% |
| Hyundai | 56,368 | 54,420 | 3.58% |
| Bajaj Auto | 329,800 | 330,109 | -0.09% |
| Hero MotoCorp | 591,306 | 612,739 | -3.50% |
| M&M | 37,829 | 39,357 | -3.88% |
| Tata Motors | 30,972 | 39,389 | -21.37% |
| Ashok Leyland | 7,083 | 10,182 | -30.44% |
For the first time in three months, DIIs outperformed their foreign peers in terms shopping in equities. They also invested heavily in the debt market, infusing almost Rs. 58,000 crores in the month. Contrary to their behavior from the past two months, the FIIs/FPIs relatively slowed down their investments in India, be it equities or be it debt. Have a look at the last four months’ data:
| FII/FPI Inflows (Rs. Cr) | April 2017 | March 2017 | February 2017 | January 2017 |
|---|---|---|---|---|
| Equity | 2394 | 30906 | 9902 | -1177 |
| Debt | 20364 | 25355 | 5960 | -2319 |
| Total | 22758 | 56261 | 15862 | -3496 |
| DII Inflows (Rs. Cr) | April 2017 | March 2017 | February 2017 | January 2017 |
|---|---|---|---|---|
| Equity | 9,917.53 | 2367.60 | 1855.00 | 6185.40 |
| Debt | 57,974.31 | 40085.10 | 38627.10 | 35770.70 |
| Total | 67,891.84 | 42452.70 | 40482.10 | 41956.10 |
The Nifty50 was trading at 23.63x at the end of April 2017, keeping steady in the 23x-24x range, even though the index has been trading at its all-time highs for quite some time now. This is clear evidence that the earnings have been picking up, and are keeping in sync with the stock prices. This is very much unlike the 2008 scenario, where the index was trading at a P/E of around 28.25. Basically, Nifty50 P/E ratio is broadly used to identify how cheap or expensive the index is. (Formula: sum of all market capitalizations/sum of consolidated earnings).
Applying the same analogy as above, P/B ratio of an index is the weighted average P/B ratio of all the stocks covered by the index, Nifty50 in our case. (Formula: closing level of the Nifty50/latest quarters’ book value per share (average of all companies))
Like the above two ratios, Dividend Yield is basically the weighted average dividend yield of all the Nifty50 companies.
| >End of Month | >P/E | >P/B | >Div. Yield |
|---|---|---|---|
| January 2017 | 22.86 | 3.25 | 1.29 |
| February 2017 | 23.13 | 3.37 | 1.25 |
| March 2017 | 23.26 | 3.50 | 1.25 |
| April 2017 | 23.63 | 3.55 | 1.23 |
(For more on this topic, please click here)
The Reserve Bank of India, in its first monetary policy of FY18, kept the Repo Rate unchanged at 6.25%, citing upward risks to inflation and global uncertainty. It increased the Reverse Repo Rate by 0.25bps to 6%, and decreased the Marginal Standing Facility (MSF) rate to 6.5%.
The key take-away from the meeting was the proposal to allow banks to invest in Real Estate Investment Trusts (REIT) and Infrastructure Investment Trusts (InvITs). Also, the surplus liquidity in the banking system declined from a high of ~Rs. 7 lakh crores on 4th January, 2017 to an average of Rs. 6 lakh crores in February to an average of Rs. 4 lakh crores in March.
The India Nikkei Services Purchasing Managers’ Index (PMI) declined to 50.2 in the month of April 2017 as against 51.5 in March 2017, thereby continuing on its path for expansion, even though barely. On the other hand, the India Nikkei Markit Manufacturing Purchasing Managers Index (PMI), with similar levels of 52.5 as in March 2017, sustained growth for the fourth straight month. Notably, a reading above 50 denotes an expansion in business activity while one below 50 implies a contraction.

As per the statistics released by Directorate General of Civil Aviation (DGCA), Government of India in mid April for the month of March, the total number of passengers carried during the March 2017 stood at 90.60 lakhs, compared to 78.72 lakhs during the same month previous year, thereby registering a growth of 15.09% Y-o-Y. The figures for May 2017 are awaited.
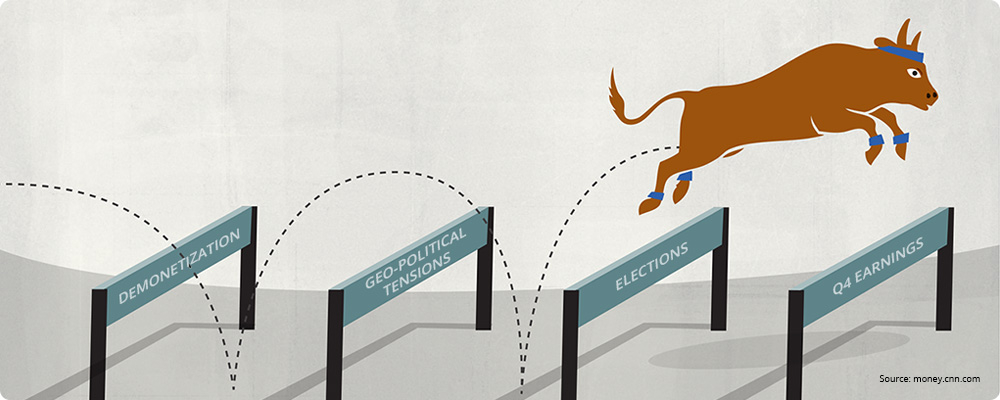
Nifty50 remained on the positive side for the fourth straight month in CY2017, swelling by a modest 1.42% for the first month of FY2018. Overall, in CY2017, the Nifty50 index value has increased by 13.66%. The relatively subdued rally in the index for the past 1-1.5 months is attributed to the cautious approach taken by the investors who are now looking forward to the first earnings post the demonetization quarter. Have a look at the performances of Nifty50, S&P BSE Mid-Cap and S&P BSE Small Cap for the month of April 2017:
| Index | Performance in April 2017 |
|---|---|
| Nifty50 | (+)1.42% |
| S&P BSE Mid-Cap | (+)4.98% |
| S&P BSE Small Cap | (+)5.43% |
After two months of phenomenal FII/FPI inflow into the Indian equity market, DIIs have now come to the party once again. But overall, one should now look forward to the Q4FY17 earnings numbers, which are expected to be relatively better than Q3FY17 numbers (hampered by Demonetization), and not the market levels, per se. One should not get intimidated by the 9,300 Nifty50 or 30,000 Sensex levels. You, as a long term investor, rather than getting over-cautious and sitting on the sidelines, should focus on the earnings that are set to come in, which will then justify the scenario. Remember, there are always businesses with great models available in the market, irrespective of the market levels. Your job is to dig them out, and we are here to help. Happy Investing!