Prime Offer: Save 20% Off on your preferred services! Apply Coupon: INVEST20 | Avail Offer
Prime Offer: Save 20% Off. Avail Offer
March 11, 2024
|
In the ever-evolving world of stock trading, where volatility reigns supreme and decisions are made in split seconds, having the right tools at your disposal can make all the difference. Charts provide a factual representation of the price performance of numerous stocks. The price changes are a direct outcome of the daily supply and demand dynamics. Investors who dedicate themselves to understanding and interpreting price movements on charts gain a significant advantage over those who either refuse to learn, lack knowledge, or exhibit laziness. Just as you wouldn't fly in a plane without instruments or embark on a long cross-country trip without a road map, charts serve as your investment road map. Among various technical tools, moving averages stand out as one of the most versatile and widely used indicators. In this comprehensive guide, we will delve deep into the intricacies of moving averages, exploring their calculation methods, interpretation techniques, practical applications, and more. Whether you're a novice investor looking to grasp the basics or a seasoned investor seeking advanced strategies, this guide aims to equip you with the knowledge and skills needed to leverage moving averages effectively in your stock selection and trading endeavors.
Moving averages, often abbreviated as MAs, are statistical indicators used to smooth out price data and identify trends over a specified period. Unlike raw price charts, which can be erratic and prone to fluctuations, moving averages provide a clearer picture of the underlying trend by filtering out noise and highlighting long-term patterns.
Moving averages serve multiple purposes in stock trading:
Trend Identification: By plotting moving averages on a price chart, investors can easily visualize the direction of the trend, whether it's bullish (upward), bearish (downward), or sideways (lateral).
Support and Resistance Levels: Moving averages act as dynamic support and resistance levels, helping invesstors identify potential entry and exit points. When prices approach a moving average from below, it often serves as a support level, while prices nearing from above may encounter resistance.
Price Reversal Signals: Moving average crossovers, where shorter-term averages intersect with longer-term ones, are commonly used as signals for trend reversals. These crossovers, such as the golden cross and death cross, can provide valuable insights into market sentiment shifts.
The simple moving average is the most basic form of moving average, calculated by summing up the closing prices of a security over a specified period and dividing by the number of periods. SMAs provide a smooth representation of price trends and are widely used in various trading strategies.
The exponential moving average is a more advanced variation of the simple moving average, giving greater weight to recent price data. This weighting scheme allows EMAs to respond more quickly to price changes, making them popular among short-term investors and trend followers.
The weighted moving average assigns different weights to each price data point, with more recent prices receiving higher weights. While similar to EMAs in terms of responsiveness, WMAs offer greater flexibility in adjusting the weighting scheme to suit specific trading preferences.
The formula for calculating a simple moving average is straightforward:
SMA=
C1+C2+C3+...+Cn
n
Where:
Each new data point replaces the oldest one in the calculation, resulting in a continuous updating of the moving average.
The exponential moving average calculation involves a more complex formula:
EMA=(Close−EMAprevious)×α+EMAprevious
Where:
The smoothing factor determines the rate at which the EMA reacts to new price data, with higher values resulting in faster adjustments.
Moving averages play a crucial role in trend analysis, helping investors identify the prevailing market direction. A rising moving average indicates an uptrend, while a falling moving average suggests a downtrend. By observing the slope and positioning of moving averages, investors can make informed decisions about trade entries and exits.
Moving averages act as dynamic support and resistance levels, guiding investors in setting stop-loss orders and profit targets. When prices bounce off a moving average repeatedly, it reinforces its significance as a support or resistance level. Investors often use these levels to gauge the strength of a trend and anticipate potential price reversals.
One of the most popular trading signals generated by moving averages is the crossover, where two moving averages intersect. The golden cross, occurring when a shorter-term average crosses above a longer-term one, signifies a bullish trend reversal. Conversely, the death cross, marked by a shorter-term average crossing below a longer-term one, indicates a bearish trend reversal.
Moving averages form the backbone of trend-following strategies, where investors aim to capitalize on sustained price movements in the direction of the trend. By aligning their trades with the prevailing market direction indicated by moving averages, trend followers seek to ride out profitable trends while minimizing losses during corrective phases.
In contrast to trend-following strategies, mean reversion strategies rely on the premise that prices tend to revert to their mean or average levels over time. Investors employing this approach use moving averages as reference points to identify overbought and oversold conditions, entering trades when prices deviate significantly from their average values.
Moving averages can also be used in volatility-based strategies, where investors adjust their trading parameters based on market volatility levels. By incorporating volatility measures such as average true range (ATR) into moving average calculations, investors can adapt their trading strategies to changing market conditions and optimize risk management.
Some investors combine multiple moving averages of varying lengths to form trading systems with enhanced signal quality and reliability. By incorporating short-term, medium-term, and long-term moving averages into their analysis, investors can filter out noise and identify high-probability trading opportunities with greater precision.
Moving average envelopes are bands plotted above and below a moving average, representing predefined percentage deviations from the average. These envelopes act as dynamic support and resistance zones, providing investors with additional reference points for setting stop-loss and take-profit levels.
The moving average convergence divergence (MACD) is a popular momentum oscillator that combines two moving averages—a fast line (typically EMA) and a slow line (typically SMA). By comparing the convergence and divergence of these moving averages, investors can identify potential trend reversals and momentum shifts with greater accuracy.
Let's examine a real-life example of how moving averages can be applied in stock trading. Suppose we have a chart showing the price movements of a particular stock over the past year. By overlaying various moving averages on the chart and analyzing their interactions with price action, we can identify key trading signals and opportunities for profit.
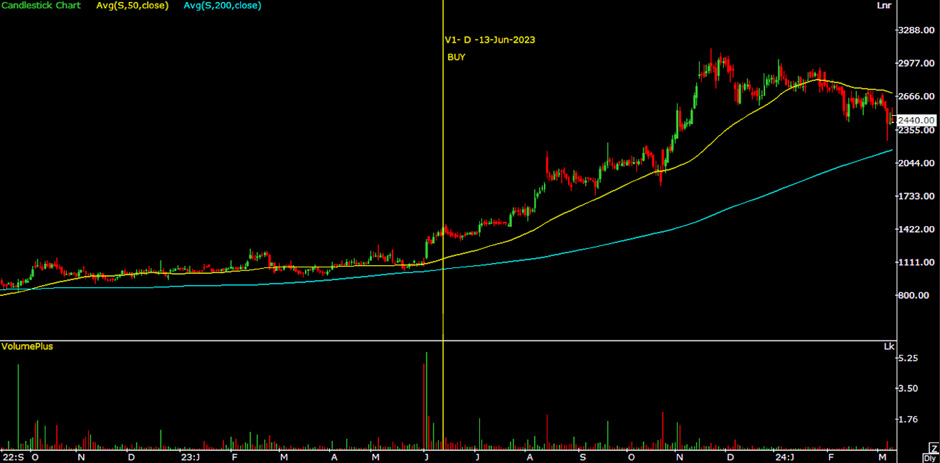
KDDL Ltd. was included in our watchlist on June 13th, 2023 because the stock was trading 26% higher than the 50-day moving average and 37% higher than the 200-day moving average on a daily chart. Upon conducting a thorough analysis of the company's fundamentals, we confidently recommended a buy rating for this stock. Our customers experienced a 71% increase in returns from their investments in KDDL.
In another scenario, let's explore how moving averages can be used to manage risk and optimize trade entries and exits. By setting dynamic stop-loss orders based on moving average levels and trailing the stop-loss as the trend progresses, investors can protect their capital while maximizing profits in trending markets.
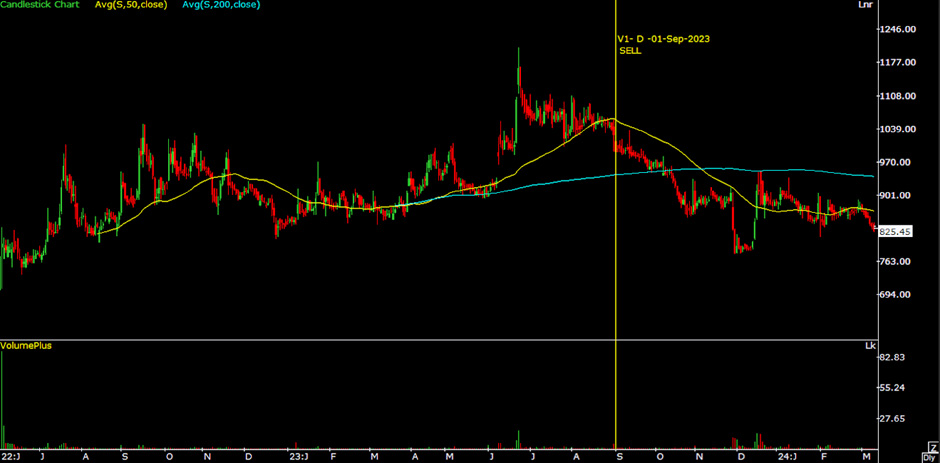
On September 1, 2023, we advised selling the stock of Aether Industries Ltd. for 1005, as the stock was trading 6% below its 50DMA and 5% above its 200DMA on a daily chart. Since then, the stock has been consistently declining. Presently, the stock is trading below its significant moving averages at 827.
While moving averages can be powerful tools in stock trading, overreliance on them can lead to suboptimal decision-making and missed opportunities. It's essential for investors to complement moving averages with other technical indicators, fundamental analysis, and market sentiment assessments to gain a comprehensive understanding of market dynamics.
To mitigate the risks associated with trading, it's crucial for investors to implement robust risk management strategies. This includes setting stop-loss orders based on moving average levels, diversifying trading portfolios, and adhering to disciplined trading plans. By managing risk effectively, investors can safeguard their capital and improve long-term profitability.
In conclusion, mastering moving averages is a fundamental aspect of successful stock trading. By understanding their calculation methods, interpretation techniques, and practical applications, investors can gain valuable insights into market trends and make informed decisions. As technology evolves and trading methodologies continue to evolve, the role of moving averages in stock trading is likely to remain prominent, serving as indispensable tools for investors of all levels.