Lemon Tree Hotels Ltd
Quarterly Result - Q1YFY23
Lemon Tree Hotels Ltd
Hotel, Resort & Restaurants
Current
Previous
Stock Info
Shareholding Pattern
Price performance
Indexed Stock Performance
Financial Highlights:
| Particulars (Rs. in Crores) | Q1FY23 | Q1FY22 | YoY | Q4FY22 | QoQ |
|---|---|---|---|---|---|
| Revenue from Operations | 192.04 | 42.15 | 355.57% | 119.54 | 60.60% |
| Operating Revenue | 87.59 | -0.08 | - | 21.59 | 305.72% |
| Operating % | 45.61% | -0.19% | 18.06% | ||
| Net Loss/Profit | 13.58 | -59.81 | - | -39.16 | - |
| Net Margin % | 7.07% | -141.88% | -32.76% | ||
| EPS | 0.18 | -0.51 | - | -0.31 | - |
Source: Company Filings; StockAxis Research
Highlights for the quarter ended June 2022
During the quarter ended June 2022, the company saw recovery in the business led
by continued traction in corporate and leisure travel. The total revenue increased
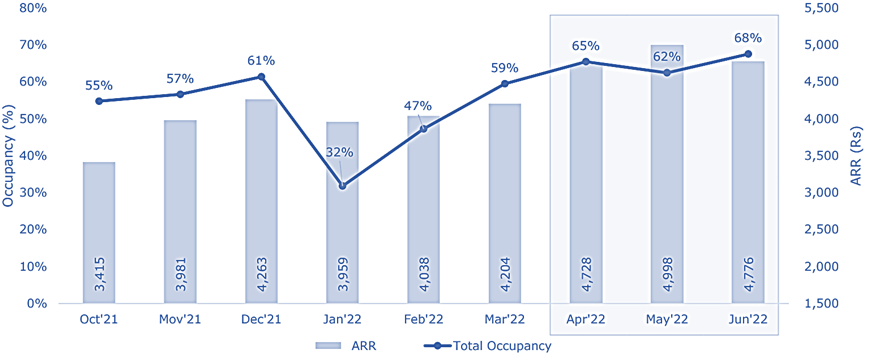
4.6x YoY and 60.6% QoQ to Rs. 192 crores. The occupancy for the quarter was 65.1%
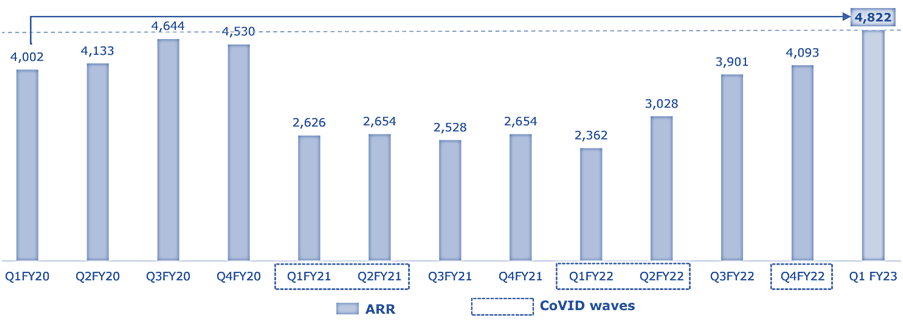
vs. 46.1% in Q4FY22 (29.6% in Q1FY22). ARR was higher by 18% QoQ to Rs. 4,822 vs.
Rs. 4,093 (Rs. 2,362 in Q1FY22). RevPAR also witnessed a growth of 66% QoQ to Rs.
3,138 vs. Rs. 1,888 in Q4FY22 (Rs. 700 in Q1FY22).


Operating revenue for the company was Rs. 87.6 crores vs. Rs. 21.6 crores in Q4FY22, up ~4x QoQ. Operating margin was 45.6% vs. ~18% in Q4FY22, supported by permanent cost rationalisation, lower stamp duty expenses related to amalgamation of Meringue Hotels, Begonia Hotels, and Nightingale Hotels with Fleur Hotels and lower other expenses. Further, despite lower other income and higher taxes, the company’s PAT stood at Rs. 13.6 crores vs. ~Rs. 39 crores losses in Q4FY22.
Key Conference Call Highlights
- The growth in topline was led by business travel. The quarter witnessed higher demand from MICE which supported the growth. ARR was the highest ever since listing and 20% higher than the pre-covid levels. On full inventory, the occupancy was 65.1% in Q1FY23.
- During the quarter, LTH signed new hotels in Vishakhapatnam, Malad, Jaipur, Assam, and Kharar. Further, it operationalized a Keys hotel in Tapovan.
- In Delhi, Hyderabad, Bengaluru, and Mumbai, occupancy increased to 73%, 73%, 76%, and 74%, respectively. However, in Gurugram, the occupancy was lower at 57%, which as per the management, is expected to increase in H2FY22.
- The lower occupancy of 37% in Aurika was due to the unrest in Udaipur and the higher room rate of more than Rs. 11,000. With the similar rates, the occupancy is expected to improve in coming quarters.
- Keys hotels in Bangalore and Pune have recovered, with occupancy in the 70-80% range. However, the occupancy In Kerala, Ludhiana, and Vizag were laggards because they are being renovated. Keys hotel occupancy is expected to be in the 65-70% range in FY23 and account for around 18% of the portfolio.
- Staff to Room cost was at 0.63x in Q1FY23, which as per the management could sustain at 0.66x going forward, compared to 0.95x in FY20. However, cost per employee has increased by 15%. Further, LTH has redesigned and fine-tuned the menu to reduce the food cost from 9% to 6%.
- Currently, Lemon Tree Mountain Resort, with 69 rooms and Aurika, Mumbai International Airport with 669 rooms is under construction and the total capex for the same is expected to be Rs. 1,000 crores and as of June 2022, the capex of 440 crores has been spent. Aurika MAIL is expected to be complete and could open for operations from the end of CY23 with the expected ARR of Rs. 12,000.
- The debt of the LTH has marginally come down from ~Rs. 1,700 crores as of March 2022 to ~Rs. 1,690 crores as of June 2022. In the next 4-5 years, the company is looking for the debt-free position.
- LTH closed Redfox hotel in Chandigarh (102 rooms) due to contractual disagreements with the landlord. As a result, the lease was terminated in May 2022. Furthermore, one more hotel in Goa (130 rooms) was closed because the landlord refused to renovate the hotel as per the LTH standards.
Outlook & valuation
The strong Q1FY23 performance was in-line with our expectations. We believe, growth in corporate and leisure travel would further support the growth of the company in medium-to-long term. The growth would be further supported by higher ARRs and higher occupancy rate. Further, the cost rationalisation would aid the operating margins along with higher operating leverage. Further, the management believes the good demand visibility for the industry in next 3-5 years. The favourable demand-supply scenario would aid the higher ARRs and would help the overall industry and the LTH business.
At the CMP of 68, the stock trades at 15.4x of FY24E EV/EBITDA.
Quarterly Financials
| Particulars (Rs. in Crores) | Q1FY23 | Q1FY22 | YoY | Q4FY22 | QoQ |
|---|---|---|---|---|---|
| Revenue from Operations | 192.04 | 42.15 | 355.57% | 119.54 | 60.60% |
| Direct Costs | 11.60 | 3.20 | 8.41 | ||
| Gross Revenue | 180.44 | 38.95 | 363.23% | 111.13 | 62.37% |
| Gross % | 93.96% | 92.41% | 92.96% | ||
| Employee Costs | 34.54 | 17.41 | 28.84 | ||
| Power & Fuel | 17.99 | 7.58 | 11.19 | ||
| Stamp Duty | 4.78 | - | 15.25 | ||
| Others | 35.55 | 14.04 | 34.26 | ||
| Operating Revenue | 87.59 | -0.08 | - | 21.59 | 305.72% |
| Operating % | 45.61% | -0.19% | 18.06% | ||
| Depreciation & Amortization | 24.50 | 26.16 | 26.52 | ||
| Net Finance Cost | 42.91 | 43.17 | 42.41 | ||
| Other Income | 0.25 | 2.13 | 7.63 | ||
| Net (Loss)/Profit Before Tax & Share of Associates | 20.43 | -67.28 | -39.72 | ||
| Share of Associates | 0.27 | -0.07 | 0.29 | ||
| Profit Before Tax | 20.70 | -67.35 | - | -39.43 | - |
| Taxes | 7.13 | -7.54 | -0.27 | ||
| Net Loss/Profit | 13.58 | -59.81 | - | -39.16 | - |
| Net Margin % | 7.07% | -141.88% | -32.76% | ||
| EPS | 0.18 | -0.51 | - | -0.31 | - |
Source: Company Filings; StockAxis Research
Consolidated Financial statements
Profit & Loss statement
| Year End March (Rs. in Crores) | 2020 | 2021 | 2022 | 2023E | 2024E |
|---|---|---|---|---|---|
| Net Sales | 669.44 | 251.72 | 402.24 | 736.73 | 966.51 |
| Expenditure | |||||
| Material Cost | 56.97 | 17.84 | 27.85 | 47.33 | 57.26 |
| Employee Cost | 155.32 | 70.39 | 97.32 | 158.40 | 202.97 |
| Other Expenses | 213.72 | 102.22 | 158.41 | 189.34 | 248.39 |
| EBITDA | 243.42 | 61.27 | 118.66 | 341.66 | 457.89 |
| EBITDA Margin | 36.36% | 24.34% | 29.50% | 46.38% | 47.38% |
| Depreciation & Amortization | 92.25 | 107.55 | 104.35 | 107.45 | 114.76 |
| EBIT | 151.18 | -46.28 | 14.32 | 234.21 | 343.12 |
| EBIT Margin % | 22.58% | -18.39% | 3.56% | 31.79% | 35.50% |
| Other Income | 10.87 | 21.99 | 14.03 | 25.79 | 33.83 |
| Interest & Finance Charges | 161.56 | 190.46 | 173.98 | 179.81 | 189.06 |
| Profit Before Tax | 0.49 | -214.75 | -145.63 | 80.19 | 187.89 |
| Tax Expense | 10.88 | -32.20 | -7.23 | 16.84 | 39.46 |
| Effective Tax rate | 2220.85% | 15.00% | 4.96% | 21.00% | 21.00% |
| Net Profit | -13.05 | -186.54 | -137.36 | 63.35 | 148.43 |
| Net Profit Margin | -1.95% | -74.11% | -34.15% | 8.60% | 15.36% |
Balance Sheet
| As of March (Rs. in Crores) | 2020 | 2021 | 2022 | 2023E | 2024E |
|---|---|---|---|---|---|
| Share Capital | 790.31 | 790.42 | 790.81 | 790.81 | 790.81 |
| Total Reserves | 198.57 | 127.16 | 40.44 | 103.78 | 252.22 |
| Shareholders' Funds | 1544.76 | 1534.97 | 1398.88 | 1462.23 | 1610.66 |
| Non Current Liabilities | |||||
| Long Term Borrowing | 1450.90 | 1513.51 | 1553.49 | 1653.49 | 1733.49 |
| Current Liabilities | |||||
| Short Term Borrowings | 59.58 | 59.56 | 145.16 | 145.16 | 145.16 |
| Trade Payables | 84.22 | 78.75 | 58.51 | 95.49 | 111.99 |
| Total Equity & Liabilities | 3758.37 | 3778.16 | 3635.03 | 3835.36 | 4080.30 |
| Assets | |||||
| Net Block | 3304.75 | 3191.45 | 3049.23 | 3191.78 | 3327.02 |
| Current Assets | |||||
| Currents Investments | 4.41 | 0.91 | 5.95 | 5.95 | 5.95 |
| Inventories | 8.22 | 7.22 | 8.12 | 9.36 | 9.80 |
| Sundry Debtors | 50.27 | 30.82 | 29.06 | 42.39 | 63.38 |
| Cash and Bank | 40.82 | 141.14 | 54.29 | 97.50 | 185.76 |
| Total Assets | 3758.37 | 3778.16 | 3635.04 | 3835.36 | 4080.30 |
Cash Flow Statement
| Year End March (Rs. in Crores) | 2020 | 2021 | 2022 | 2023E | 2024E |
|---|---|---|---|---|---|
| Profit After Tax | -10.39 | -182.55 | -138.40 | 63.35 | 148.43 |
| Depreciation | 92.25 | 107.55 | 104.35 | 107.45 | 114.76 |
| Changes in Working Capital | -96.71 | -32.39 | 2.75 | 22.41 | -4.93 |
| Cash From Operating Activities | 150.99 | 41.01 | 135.30 | 193.21 | 258.27 |
| Purchase of Fixed Assets | -644.49 | -70.44 | -67.55 | -250.00 | -250.00 |
| Free Cash Flows | -493.50 | -29.43 | 67.75 | -56.79 | 8.27 |
| Cash Flow from Investing Activities | -608.23 | -65.59 | -61.30 | -250.00 | -250.00 |
| Increase / (Decrease) in Loan Funds | 241.46 | 59.77 | 13.39 | 100.00 | 80.00 |
| Cash from Financing Activities | 456.67 | 111.22 | -163.02 | 100.00 | 80.00 |
| Net Cash Inflow / Outflow | -0.56 | 86.64 | -89.02 | 43.21 | 88.27 |
| Opening Cash & Cash Equivalents | 31.40 | 40.82 | 127.46 | 54.29 | 97.50 |
| Closing Cash & Cash Equivalent | 40.82 | 127.46 | 54.29 | 97.50 | 185.76 |
Key Ratios
| Year End March | 2020 | 2021 | 2022 | 2023E | 2024E |
|---|---|---|---|---|---|
| Basic EPS | -0.16 | -2.34 | -1.73 | 0.80 | 1.87 |
| Diluted EPS | -0.16 | -2.34 | -1.73 | 0.80 | 1.87 |
| Cash EPS (Rs) | 1.00 | -0.99 | -0.42 | 2.16 | 3.32 |
| Book value (Rs/share) | 19.44 | 19.28 | 17.66 | 18.46 | 20.33 |
| ROCE (%) | 5.89% | -0.79% | 0.91% | 8.18% | 11.17% |
| ROE (%) | -0.92% | -12.11% | -9.36% | 4.43% | 9.66% |
| PE | -383.82 | -26.86 | -36.29 | 85.04 | 36.29 |
| P/BV | 3.26 | 3.29 | 3.59 | 3.68 | 3.34 |
| EV/EBITDA | 26.90 | 107.58 | 56.19 | 20.75 | 15.45 |
| P/Sales | 7.53 | 20.05 | 12.49 | 7.31 | 5.57 |
| Net debt/Equity | 0.98 | 1.01 | 1.18 | 1.16 | 1.05 |
| Net Debt/ EBITDA | 6.20 | 25.19 | 13.86 | 4.98 | 3.68 |
| Sales/Net FA (x) | 0.27 | 0.08 | 0.13 | 0.24 | 0.30 |