Rajratan Global Wire Ltd
Quarterly Result - Q4FY22
Rajratan Global Wire Ltd
Steel & Iron Products
Current
Previous
Stock Info
Shareholding Pattern
Price performance
Indexed Stock Performance
Financial Highlights:
| Particulars (Rs. in Crores) | Q4FY22 | Q4FY21 | YoY | Q3FY22 | QoQ |
|---|---|---|---|---|---|
| Revenue from Operations | 247.60 | 183.65 | 34.81% | 221.83 | 11.60% |
| EBITDA | 47.55 | 32.42 | 46.70% | 47.34 | 0.44% |
| EBITDA Margin (%) | 19.20% | 17.70% | 21.30% | ||
| Profit After Tax | 37.03 | 23.21 | 59.54% | 32.77 | 13.00% |
| Net Profit Margin (%) | 14.96% | 12.64% | 14.77% | ||
| Earnings Per Share | 7.29 | 4.57 | 59.52% | 6.45 | 13.02% |
Source: Company Filings; StockAxis Research
Result Highlights
The company reported excellent results for the quarter ended March 2022, although
margins were hurt because the company had to absorb increased raw material prices
in February and March 2022. Normally, the company enters contracts with its customers
for three months and procures raw materials on a monthly basis, which explains why
Rajratan was unable to pass on higher raw material costs, resulting in lower margins
in Q4FY22. However, the company's management stated that it is in talks with
its clients about passing on the higher pricing, which would help the company achieve
stronger margins in the following quarters.
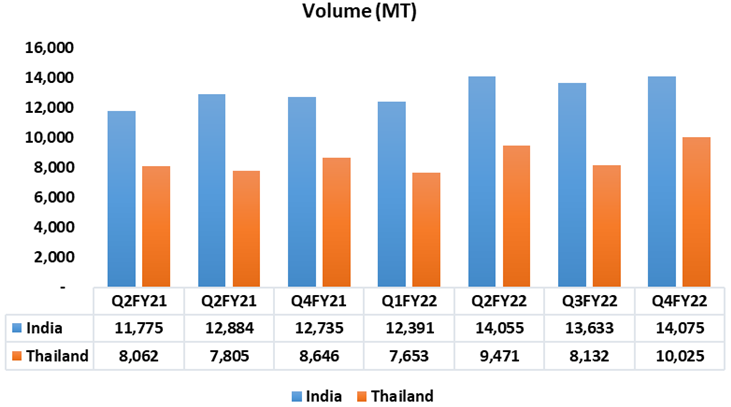
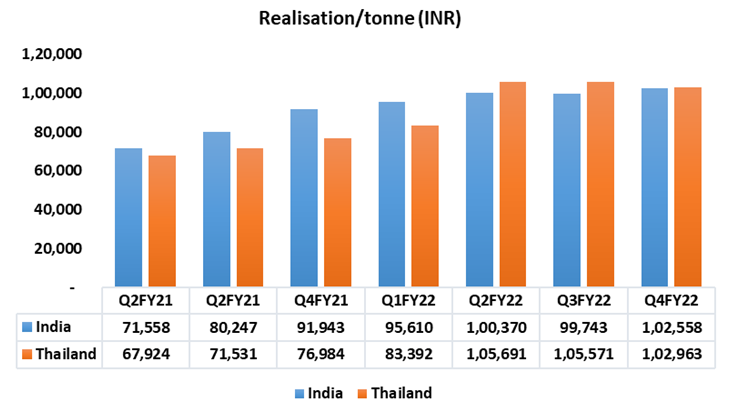
The company's topline increased by 11% QoQ to Rs. 248 crores, owing to higher volume (up 11% QoQ) and marginally higher realisation. Despite rising input costs, absolute EBITDA for the quarter was nearly flat. EBITDA margin, on the other hand, was down ~210 basis points from the previous quarter. EBITDA/tonne decreased by 9.3% sequentially, but is up by 30% on a YoY basis. Profit after tax was higher by 13% QoQ to Rs. 37 crores due to deferred tax credit.
For the whole year (FY22), the company's topline has increased by 63.4% YoY, to Rs. 893 crores. The sales volume increased by 27%, while the realisation increased by 29%. EBITDA nearly doubled to Rs. 182 crores, compared to Rs. 92 crores in FY21, with a margin increase of 350 basis points to 20.3%. EBITDA/tonne increased by 56% YoY. PAT increased by 2x YoY to Rs. 124 crores, up from Rs. 53 crores in FY21.
Volume and Realization Trend


Four tyre companies have moved manufacturing base from China to Thailand in the previous couple of years, resulting in increasing demand for bead wire. The bead wire market in Thailand was anticipated to be 80,000 MTPA in FY21, and is further expected to increase at a CAGR of 8%-10% over the next three years, owing to decreasing imports from China and new tyre capacity addition by key tyre producers. The company, as Thailand's sole manufacturer of bead wire, has benefited significantly from an increase in demand in the country as a result of the Chinese government's withdrawal of rebates and a recent reduction in volume supply by one of the major suppliers. The Thailand business of the company will increase market share by increasing its share of business with existing clients and gaining new consumers.
Conference Call Highlights
- With the upcoming capacity at Thailand (expected in Q1FY23) and new planned capacity in Chennai, the performance of the company is expected to continue. This will also aid in increase the local market share (in Thailand the management is targeting 35%-40% market share as it is the only manufacturer) and boost exports (the management is targeting 40%-50% of the volume from new Chennai plant to export to South East Asia, Europe, and the USA).
- In the 1st week of April 2022, the company has done the ground breaking of the Chennai Plant and work has started. The company targets to roll out first coil from the Chennai plant before end of Q4FY23. Though, as per the management, it may not be the significant sales quantity.
- The Capex for Chennai plant and capex of additional 20,000 MT capacity in Thailand is expected to be ~Rs. 380 crores (Rs. 300 crores for Chennai Plant and balance for Thailand).
- To fund the above mentioned capex, the company will use combination of debt and internal accruals. The management has decided to fund it with a loan of Rs. 100 crores.
- The Q4FY22 margins were impacted as the company had to absorb the commodity price increase for the February and March months. The company usually has three months contracts with its customers and on the other hand, it procures raw material on a monthly basis, therefore margin got impacted. However, the management said that the price discussions are happening with customers.
- Due to the expansion undertaken by the company two years back, the cost of making the bead wire has reduced (if the company uses the capacity at 90%-95%, the cost further goes down) along with the price hikes, the margins of the company are stable if we consider the year as a whole.
- Thailand business profitability has come at par with India as the capacity utilization of Thailand plant has increased to 90%-95% during H2FY22.
- The management expects 20%-25% volume growth in FY23 on the back of 7-8% CAGR in Indian Tire market & higher demand in Thailand.
- The size of Indian market is 120,000 tonnes (including cycle tyres) and the market share of the company in auto tyres is between 45%-50%.
Outlook & valuation
We believe Rajratan is well-positioned to benefit from the global and domestic tyre industries' potential growth as a result of potential growth in the automotive industry and a strong replacement market, as the company currently holds 45% to 50% domestic market share and 20% market share in Thailand. Given the increased capacity that will be commissioned in Thailand in Q1FY23, management anticipates a 15% to 20% increase in market share.
Furthermore, it is the preferred supplier of the big and marquee names in the tyre industry, and has solid partnership with them as the sole player with a niche focus in the manufacturing of bead wire with a focus on high-quality. Domestic capacity expansion and expansion programmes in Thailand are likely to improve revenue growth in the medium to long term. The stock is trading at ~16x of FY24E earnings.
Quarterly Financials
| Particulars (Rs. in Crores) | Q4FY22 | Q4FY21 | YoY | Q3FY22 | QoQ |
|---|---|---|---|---|---|
| Revenue from Operations | 247.60 | 183.65 | 34.81% | 221.83 | 11.60% |
| COGS | 154.19 | 115.39 | 130.02 | ||
| Gross Profit | 93.38 | 68.26 | 36.80% | 91.81 | 1.71% |
| Gross Profit Margin (%) | 37.72% | 37.17% | 41.39% | ||
| Employee Benefit Expenses | 8.87 | 7.91 | 8.07 | ||
| Other Expenses | 36.96 | 27.93 | 36.40 | ||
| EBITDA | 47.55 | 32.42 | 46.70% | 47.34 | 0.44% |
| EBITDA Margin (%) | 19.20% | 17.70% | 21.30% | ||
| Depreciation & Amortisation | 3.99 | 3.60 | 3.96 | ||
| EBIT | 43.56 | 28.82 | 51.15% | 43.38 | 0.41% |
| EBIT Margin (%) | 17.60% | 15.69% | 19.56% | ||
| Finance Cost | 4.03 | 3.84 | 3.87 | ||
| Other Income | 0.72 | 0.59 | 0.52 | ||
| Profit Before Tax | 40.25 | 25.57 | 57.41% | 40.03 | 0.55% |
| Tax Expenses | 3.22 | 2.36 | 7.26 | ||
| Effective Tax Rate (%) | 8.00% | 9.23% | 18.14% | ||
| Profit After Tax | 37.03 | 23.21 | 59.54% | 32.77 | 13.00% |
| Net Profit Margin (%) | 14.96% | 12.64% | 14.77% | ||
| Other Comprehensive Income | 2.04 | -2.92 | 1.80 | ||
| Total Comprehensive Income | 39.07 | 20.29 | 34.57 | ||
| Earnings Per Share | 7.29 | 4.57 | 59.52% | 6.45 | 13.02% |
Source: Company Filings; StockAxis Research
Consolidated Financial statements
Profit & Loss statement
| Year End March (Rs. in Crores) | 2020 | 2021 | 2022E | 2023E | 2024E |
|---|---|---|---|---|---|
| Net Sales | 480.21 | 546.54 | 892.86 | 1172.62 | 1407.21 |
| Expenditure | |||||
| Material Cost | 297.04 | 340.64 | 536.95 | 703.57 | 844.32 |
| Employee Cost | 27.05 | 28.10 | 32.69 | 42.00 | 56.29 |
| Other Expenses | 88.09 | 85.69 | 141.63 | 173.55 | 206.86 |
| EBITDA | 68.03 | 92.11 | 181.59 | 253.50 | 299.74 |
| EBITDA Margin | 14.17% | 16.85% | 20.34% | 21.62% | 21.30% |
| Depreciation & Amortization | 12.09 | 14.10 | 15.52 | 20.96 | 30.04 |
| EBIT | 55.94 | 78.01 | 166.07 | 232.54 | 269.69 |
| EBIT Margin % | 11.65% | 14.27% | 18.60% | 19.83% | 19.17% |
| Other Income | 1.17 | 1.63 | 2.00 | 2.50 | 3.00 |
| Interest & Finance Charges | 13.39 | 13.38 | 15.43 | 17.74 | 22.25 |
| Profit Before Tax | 43.72 | 66.26 | 152.64 | 217.30 | 250.44 |
| Tax Expense | 10.67 | 13.13 | 28.31 | 47.81 | 55.10 |
| Effective Tax rate | 24.41% | 19.82% | 18.55% | 22.00% | 22.00% |
| Net Profit | 33.05 | 53.13 | 124.33 | 169.50 | 195.34 |
| Net Profit Margin | 6.88% | 9.72% | 13.92% | 14.45% | 13.88% |
Balance Sheet
| As of March (Rs. in Crores) | 2020 | 2021 | 2022E | 2023E | 2024E |
|---|---|---|---|---|---|
| Share Capital | 10.15 | 10.15 | 10.15 | 10.15 | 10.15 |
| Total Reserves | 163.33 | 216.39 | 330.81 | 490.15 | 675.34 |
| Shareholders' Funds | 173.48 | 226.54 | 340.96 | 500.30 | 685.49 |
| Non Current Liabilities | |||||
| Long Term Borrowing | 53.60 | 59.24 | 53.80 | 156.71 | 151.71 |
| Deferred Tax Assets / Liabilities | 11.33 | 10.58 | 9.67 | 9.67 | 9.67 |
| Current Liabilities | |||||
| Short Term Borrowings | 82.94 | 70.31 | 82.91 | 80.00 | 80.00 |
| Trade Payables | 40.32 | 49.11 | 116.44 | 166.94 | 208.51 |
| Other Current Liabilities | 15.89 | 21.45 | 12.90 | 12.90 | 12.90 |
| Total Equity & Liabilities | 385.36 | 451.10 | 616.84 | 926.68 | 1148.44 |
| Assets | |||||
| Net Block | 228.93 | 242.34 | 281.20 | 420.24 | 550.20 |
| Long Term Loans & Advances | 2.13 | 5.34 | 22.07 | 22.07 | 22.07 |
| Current Assets | |||||
| Inventories | 41.32 | 51.00 | 81.91 | 117.42 | 146.66 |
| Sundry Debtors | 83.73 | 116.61 | 180.95 | 258.89 | 323.36 |
| Cash and Bank | 3.09 | 7.50 | 8.44 | 75.78 | 83.87 |
| Total Assets | 385.36 | 451.10 | 616.85 | 926.68 | 1148.44 |
Key Ratios
| Year End March | 2020 | 2021 | 2022E | 2023E | 2024E |
|---|---|---|---|---|---|
| EPS | 31.79 | 51.39 | 24.49 | 33.38 | 38.48 |
| Cash EPS | 43.42 | 65.03 | 27.55 | 37.51 | 44.39 |
| DPS | 2.00 | 8.00 | 2.00 | 2.00 | 2.00 |
| Book value (Rs/share) | 166.86 | 219.13 | 67.16 | 98.54 | 135.02 |
| ROCE (%) Post Tax | 14.86% | 19.17% | 32.84% | 30.19% | 25.72% |
| PE | 5.79 | 14.97 | 25.73 | 18.87 | 16.00 |
| P/BV | 0.23 | 0.72 | 9.38 | 6.39 | 4.67 |
| Dividend Yield (%) | 5.31% | 5.10% | 0.32% | 0.32% | 0.32% |